Wednesday, January 25, 2017

Ireland’s “traditional” Industrial and Food Manufacturing Sectors

Some of the recent industrial production data has pointed to a slowdown in the Irish economy.  This is particularly true of the “traditional” sub-index in the data.  Here are the annual changes in the volume of production in this sector since 2011.

Traditional Sector IP Annual Volume Growth

Annual growth rates have declined from around 10 per cent in late-2014/early 2015 to showing contraction in the most recently available data.

The “traditional” sector is simply the residual of the sectors that are included in the “modern” sector.  Sectors are included in the modern sector if 85 per cent or more of the turnover in that sector is generated by foreign-owned companies.  The sectors in the modern sector are:

  • NACE 20: Chemical products
  • NACE 21: Basic Pharmaceutical products and preparation
  • NACE 26: Computer, electronic and optical equipment 
  • NACE 27: Electrical equipment
  • NACE 18.20: Reproduction of recorded media
  • NACE 32.50: Medical and dental instruments and supplies

Under the current weightings these sectors comprise around 60 per cent of the overall index so the remaining sectors which give us the “traditional” sector make up the other 40 per cent.

The main sectors of the traditional sector are:

  • NACE 10: Manufacture of food products (0.65)
  • NACE 11: Beverages (0.28)
  • NACE 24-25: Basic metals and fabricated metal products (0.54)
  • NACE 28: Machinery and equipment, not elsewhere classified (0.41)
  • NACE 35: Electricity, gas, steam and air conditioning supply (0.33)

Between them, these categories make up around three-quarters of the “traditional” sector so whatever if driving the pattern in the chart above show be identifiable in one or more of these categories.

The numbers in the brackets give the correlations between the annual growth rates for these categories and the annual growth rates of the “traditional” sector.  The two that probably stand out are those for food products and basic metals and the weighting for food products is about ten times greater than that for basic metals.

The growth rates for each of the five sectors can be seen here but just taking the first category above, i.e. the manufacture of food, gives the following:

Food Sector IP Annual Volume Growth

And this, it seems likely,  is where the pattern for the overall “traditional” sector comes from.  As the manufacture of food products makes up about one-third of the “traditional” sector, naturally the swings in this category are larger than for the overall sector.  The change in the growth rates is from annual growth of 20 per cent in early 2015 to negative growth approaching minus 10 per cent in the most recent data.

The data break go further and break the food sector into the following sub-categories:

  • NACE 101: Meat and meat products (0.52)
  • NACE 105: Dairy products (0.10)
  • NACE 107: Bakery and farinaceous products (0.60)
  • NACE 106,109: Grain mill and starch products; Prepared animal feeds (0.29)
  • NACE 102-104, 108: Other food products (0.92)

All the annual growth rates are shown here but it is pretty obvious (from the correlations which are again shown in brackets) which category to focus on.  That is ‘Other Food Products’ which by weighting makes up about three-quarters of the manufacture of food category. 

This could be fish (NACE 102), fruit and vegetables (NACE 103) or oils and fats (NACE 104) but we are probably looking at something in the broad other category (NACE 108).  With retail sales for food not showing anything like the volatility described above we should probably turn to the export data to see where these patterns are reflected. But nothing in the food export data (commodities categories 00 to 09) fits what we have seen here.

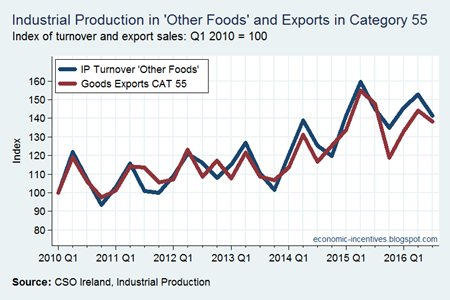
However, there is another export category that seems to fit the bill.  Here is the quarterly industrial production turnover index for Other Food with a quarterly index of exports for commodity category 55. 

Turnover 108 and Exports 55

I think we found a match.  The output from “Other Foods” in the Industrial Production data is sold under Category 55 in the External Trade data.  Category 55 is listed in the trade data as “Essential oils, perfume materials, toilet preparations etc.” which doesn’t seem to match.

If we look at the more detailed Trade Statistics releases we can see that Category 551: Essential Oil, Perfume and Flavour Materials is where most of the exports in Category 55 arise from with the bit “Flavour Materials” getting us back to something food related.  Going a little further it can be seen that all the action is in Category 551.41: Mixtures of odoriferous substances for use in food/drink.  In 2015, exports in Category 551.41 were €7.3 billion.  The use of “odoriferous” suggests something that smells but it’s much more likely to be related to some form of concentrate.  Total exports for Category 55 in 2015 were €8.0 billion so we can see that 551.41 provided over 90 per cent of those.

I’m not going to check the Trade Statistics release but item 551.41 seems to one of our most widely dispersed exports with country data provided for 56 countries.  Exports for Jan-Oct for recent years are:

  • 2013: €4,743 million
  • 2014: €5,274 million
  • 2015: €6,234 million
  • 2016: €6,132 million

And we see strong growth in 2015 of near 20 per cent with a steep slowdown resulting in a contraction in 2016.  Just as has been described as happening in Ireland’s “Traditional” manufacturing sector.

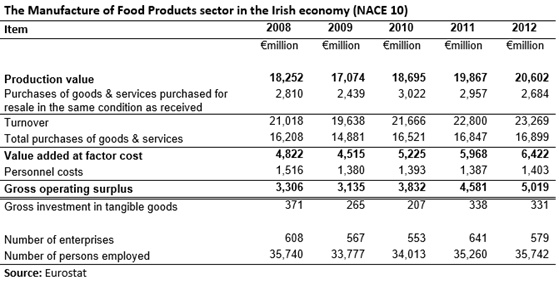
This suggests it is probably worth taking a broad look at the “food manufacturing” sector in Ireland.  Here is some aggregate data for the sector.

Irish Food Industry NACE 10

Unfortunately, the data only go up to 2012 but by then we can see that we have an industry with an output of €20 billion from over 500 companies with 35,000 employees.  [The data cover enterprises with 10 or more employees.]  These companies generated a gross value added of nearly €6.5 billion,with around €1.5 billion going in pay to employees leaving a Gross Operating Surplus of €5 billion.  Ireland’s food industry seems remarkably profitable.

However, the analysis of the industrial production and export data means that it is probably worthwhile to sub-divide the industry into domestically-owned and foreign-owned sectors.  Here is the contribution of foreign-owned enterprises to Ireland’s food manufacturing industry.

Irish Food Industry NACE 10 - Foreign Owned

We can see that almost half of the production arose in just 30 foreign-owned companies who have about 15 per cent of the persons employed in the industry.  These are higher-paying companies as they contribute 25 per cent of the personnel costs of the industry with an average cost per employee of €62,500. 

These companies generate around 70 per cent of the gross value added in the industry and earn about 85 per cent of the gross operating surplus (with a gross operating rate of over 35 per cent in 2012).  It turns out the Irish food sector is so Irish after all.  Inclusion in the “modern” sector as defined by the CSO requires 85 per cent of the turnover from a sector to come from foreign-owned firms.  Although the manufacture of food products achieves this for gross operating surplus, the proportion of turnover generated by foreign-owned firms is around 50 per cent.

In 2012, exports in category 551.41 were €5.7 billion which is 60 per cent of the production value shown above.  The  manufacture of food products industry in Ireland is very concentrated.

For completeness, here is the contribution of domestically-owned enterprises to the Irish food manufacturing industry.

Irish Food Industry NACE 10 - Domestically Owned

In contrast to the foreign-owned companies, domestically-owned companies had a gross operating rate of 7 per cent in 2012 (GOS as a per cent of turnover).  The labour share of gross value added was almost 60 per cent though average personnel costs per person employed were €35,000 – almost 45 per cent lower than in foreign-owned companies in the sector.

What should we take from all this?  Simply that Ireland’s “traditional” manufacturing sector may be subject to many of the same MNC effects we see in the “modern” sector so interpreting changes as reflective of the economy outside the MNCs may not be appropriate.

Tuesday, January 17, 2017

Ireland’s trade in aircraft–our largest goods import

In 2015 our trade statistics moved to a transfer of ownership basis for recording trade in aircraft.  Prior to this aircraft were recorded in the country where they were registered.  They are now recorded in the jurisdiction where the owner is resident. 

The previous approach generally only picked up aircraft owned by Aer Lingus and Ryanair with some sundry others.  The revised approach means that aircraft owned by leasing companies which are resident in Ireland are now included.  This has seen the recorded annual trade in large aircraft for Ireland move from double digits to treble digits, with imports now regularly exceeding €10 billion.

Here is revised data back to the year 2000 based on the transfer of ownership approach.

792.40 Aircraft

Since the year 2000, Irish-resident entities have purchased over 3,000 wide-body aircraft while selling about 1,000 less.  The value of imports is €96.2 billion compared to €23.6 billion for aircraft sold.  It can be seen that the average value of aircraft purchased is about three times the average value of aircraft sold (€31 million versus €11 million).

Aircraft imports for 2016 already exceed €10 billion even though the detailed data from the Trade Statistics have as yet only being compiled to October.  Aircraft are Ireland’s largest goods import exceeding food and live animals (€6.6 billion in 2015), oil and gas (€4.9 billion), medicinal and pharmaceutical products (€5.4 billion), organic chemicals (€3.8 billion), cars and other road vehicles (€3.5 billion).  Since 2010, wide-body aircraft have average 15 per cent of total goods imports in the External Trade Statistics.

All these aircraft are included in Ireland’s capital stock.  Aircraft leasing forms part of the Administration and Support Services Activities sector (Nace N).  Given the value of wide-body aircraft it is fairly safe to assume that most of the Transport Equipment assets held by this sector are held by aircraft leasing companies. [Aer Lingus, Ryanair and aircraft leased by operators will be in Nace H – transportation and storage.]

The left panel of the following table gives the nominal value of transport equipment assets in the sector.

Capital Stock of Aircraft

At the end of 2014, Ireland had a stock of wide-body aircraft with a gross value (i.e. valued at the price of new capital goods) of something approaching €86 billion, double the level recorded in 2009.  If the age and depreciation are taken into account the value was around €50 billion at the of 2014.  These increases in the capital stock of aircraft will also be contributing to increases in the provision for depreciation in the national accounts (though can only be part of the reason why the provision for depreciation jumped from €30 billion to €60 billion in 2015). 

The 2016 capital stock figures won’t be published until the end of the year but the figures for transport equipment are likely to be suppressed, just as they were in 2015 due to confidentiality reasons (in another category).  The Irish Aviation Authority says that there are over 4,000 aircraft under Irish management with a value of $120 billion.

We can get some indication of the evolution of Ireland’s stock of wide-body aircraft from other CSO data. The trade data show that since the start of 2015 net imports have been €13 billion.  The trade data will include purchases by Irish-resident entities but will omit the transfer to Ireland of aircraft owned by entities who re-domicile and become Irish-resident.

We can also get an indication from the Balance of Payments by looking at export income from operational leasing.  This is given in the right panel above along with the ratio of such income to the net capital stock of transport equipment in NACE N.

While the import of the aircraft is largely GDP neutral – as the negative import figure will be offset by a positive investment figure – the income from these leasing activities is GDP positive (as, one assumes, is the export sale of the aircraft).  And with much of the income  being absorbed by the provision for depreciation it will also form part of Ireland’s GNI.

The change in treatment means that Ireland’s current account balance in the Balance of Payments has been revised down (by the revised net trade amount in aircraft).  For 2015 it can be seen from the first table that this reduced the current account by around €6 billion.  That knocked a small bit off the bizarre look of our current account which recorded a €26 billion surplus in 2015 (with that largely being the gross operating surplus that a small number of Irish-resident subsidiaries of MNCs are using to  repay debt as discussed here).

Monday, January 16, 2017

The business sector in Ireland in the latest institutional sector accounts

The previous post looked at the household sector in the Non-Financial Institutional Sector Accounts published last week by the CSO.  Here we look at the non-financial corporate sector, which is where all the action is in relation to the recent leaps in Ireland’s national accounting aggregates (26 per cent GDP growth and all that), but really doesn’t tell us much about the general performance of Ireland’s business sector.

First, here’s the current account with all the figures relating to Q1 to Q3 totals for the years from 2012 to 2016.

NFC Sector Accounts Q1-Q3  2012-2016

The big jump can seen in the Gross Domestic Product (close to value added) for 2015.  The 2014 figure was €82.8 billion and the 2015 figure was €123.3 billion.  The step-level change was maintained in 2016.

As noted in the household accounts, there has been a rapid rise in the amount of wages paid from the corporate sector.  The table above shows that ‘compensation of employees’ from non-financial corporates has increased from €30 billion in the first three quarters of 2012 to just over €38 billion for the same period in 2016.

But with value added rising by a much greater amount than employee compensation that means Gross Operating Surplus of the NFC sector is also much greater. In fact, GOS in the first three quarters of 2016 is double the level recorded in 2012: €87.4 billion versus €43.6 billion.

Perhaps unexpectedly, a substantial increase of more than €40 billion in the Gross Operating Surplus of the NFC sector has not transformed into a similar increase in dividend payments or retained earnings liabilities to shareholders.  In 2012, the sum of dividends paid to and retained earnings owed to shareholders was just under €26 billion for the first three quarters of the year.  For the same period of 2016 these summed to €34 billion.  A rise, yes, but only equivalent to about one-fifth of the rise in Gross Operating Surplus.

This means that the resources available by use by Irish-resident entities (though not necessarily Irish-owned) has increased substantially.  Compared to the first three-quarters of 2012, the Gross National Income of the NFC sector has increased 150 per cent: going from €22.9 billion for Q1-Q3 2012 to €57.3 billion in Q1-Q3 2016.  Gross National Income is a key input into the determination of a country’s EU contribution.

The companies are paying additional Corporation Tax on this income with income and wealth taxes for the first three quarters of the year rising from €1.8 billion in 2012 to €3.4 billion in 2016.  We should pause a little before reaching too many conclusions about the additional tax just yet as the income measures we are looking at are all gross, i.e. before the deduction of depreciation.

By subtracting income tax and netting off some capital transfers we are left with the Gross Disposable Income of the NFC sector and consistent with all the other measures this has shown a huge increase since 2012 with most (but not all) of the increase occurring with the step-level change in 2015.  Retained earnings owed to re-domiciled PLCs also introduces some volatility into the series.  See this note from the CSO.

Anyway, if NFCs have generated more than €50 billion of Gross Disposable Income (which is also Gross Savings as companies do not have any final consumption expenditure) in the first three quarters of 2016 it is probably worth trying to see what they are doing with it.  To that end, we can start by looking at the capital account to see if they are investing it.

NFC Sector Capital Accounts Q1-Q3  2012-2016

The first panel shows us that a huge amount of the increase in Gross Savings is being absorbed by an increase in depreciation (consumption of fixed capital).  Companies in Ireland are generating substantially more gross income but a lot of this will be devoted to their capital stock which will require re-investment or replacement – or that’s what the figures indicate at any rate.  As we don’t know what the assets are the link between their depreciation and the amount required to maintain and/or replace them is difficult to know.

There has been an increase of more than 50 per cent in the level of investment undertaken by the NFC sector from under €20 billion in the years up to 2014 to more than €30 billion for the two years since (again the figures are Q1 to Q3 totals).  But it can be seen that even with this additional investment the amount is less than the consumption of fixed capital (i.e. depreciation) so for each of the past two years net capital formation has been negative – investment in new capital has not been sufficient to cover the depreciation of existing capital.

However, it is impossible to tell if this is telling us anything important about the Irish business sector as the figures are so heavily polluted by the impact of a relatively small number of MNCs.  Investment is up because of purchasing of IP by Irish-resident entities and depreciation jumped massively because entities with huge amounts of IP on their balance sheets became Irish-resident.  The underlying position of domestic Irish companies is impossible to tell from these figures.

Anyway to continue with our story.  With investment less than savings this means that the NFC sector is a net lender, as it has been for four of the past five years with substantial amounts arising for each of the past two years.  The figures in the table only cover nine months of each year but show that the NFC sector has had around €30 billion of net lending available.  For full-year outturn the amount for the past two years is likely to come to over €40 billion. 

What are the companies doing with this money?  Repaying debt would seem the likely answer.  The CSO only publish the institutional sector financial accounts on an annual basis so they don’t really offer the up-to-date figures that are required.  We can, though, get some insight from the international investment position data published with the Balance of Payments.

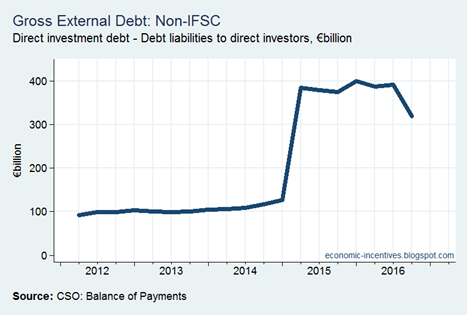
Here are the debt liabilities to direct investors of Irish-resident entities since 2012. 

Direct Investment Debt 2016

The huge jump (of a quarter of a trillion!) in Q1 2015 is likely related to entities with huge debts becoming Irish-resident.  These entities brought assets with them and these assets  resulted in the huge increase in the amount of gross operating surplus generated here.  There are likely to be lots of moving parts with some companies borrowing and others repaying debt but the overall thrust of the net lending of the NFC sector going to repay the debt shown here is more than likely correct.  And maybe leads to questions about the inclusion of it in our Gross National Income if these assets move on again.

And what does all of this tell us about the domestic Irish business sector? Absolutely nothing.

Friday, January 13, 2017

The latest household sector accounts

The CSO have published the Q3 2016 update of the Non-Financial Institutional Sector Accounts.  Here we focus on the household sector and try to reproduce the accounts in a somewhat readable form.

First, the current account with figures for the sum of the first three quarters extracted for a selection of years.

Household Sector Accounts Q1-Q3  2007-2016

Estimates of output and intermediate consumption are only provided with the annual versions of these accounts so we start with Gross Domestic Product (akin to value added).  After subtracting wages paid by the household sector (by the self-employed etc.) and netting out taxes and subsidies on production we are left with Gross Operating Surplus/Mixed Income of the household sector.

This has risen to €17.8 billion from the €15.0 billion trough for the first three quarters of 2011 but remains below the 2007 peak of €19.2 billion (likely due to much reduced self-employed and contracting work in the construction sector).

Compensation of employees (wages) is up on 2007 levels.  The total of wages received from all sectors for the first three quarters of 2007 was €57.8 billion while the first quarters of 2016 recorded a total of €62.1 billion.  This improvement is driven by increases in wages paid from the corporate sectors with wages from the government and household sectors largely flat.

Compensation of employees from the non-financial corporate sector for the first three quarters of the year has improved from €29.5 billion in 2011 to €38.3 billion in 2016, a 29.8 per cent increase that definitely does mean something positive.  Pay from financial corporates is up on 2007 but has been flat for the past few years.

With our heavily-indebted households also benefitting from lower interest rates (though note the FISIM adjustment affects the interest figures in the table) it means that the Gross National Income of the household sector is now ahead of the 2007 level with Q1-Q3 aggregates of €77.9 billion then versus €82.1 billion now.  And compared to the trough of €66.9 billion in 2011 the increase is obviously much larger.

Although taxes on income and wealth and social contributions paid to the government (mainly PRSI) are higher than 2007 (up €3.5 billion) these are largely offset by increased social benefits paid by the government sector (up €3 billion).  This means that the changes in Gross Disposable Income largely track the changes in Gross National Income (though obviously there will be distributional effects that these aggregate data cannot pick up).

Gross Disposable Income has grown 10 per cent in the past two years.  The annual rate of growth for the first three quarters of the year has slowed from the 5.8 per cent recorded in 2015 to 3.6 per cent in 2016.  Still a pretty impressive lick all the same.

While the household sector has extra income available for consumption it is not being spent.  Gross Disposable Income for Q1-Q3 might be around €4 billion up on its 2007 level but household consumption expenditure is fairly close to the 2007 level (€66.3 billion in Q1-Q3 2016 versus €65.5 billion in 2007).

Income growing by more than spending means that the savings rate is higher.  The gross savings rate has hovered around 13 per cent in Q1-Q3 for the past few years compared to 10 per cent in 2007.  Our annual consumption splurge in Q4 will probably bring the full-year rate for 2016 down to around 11 per cent but this is well up on the levels seen in the years up to 2007 when it was consistently below 10 per cent.

Of course, the next question is what are we doing with those savings?  In 2007 we were using them (and a whole lot of borrowing) to buy houses.  That ended abruptly and the picture from the capital account has been wholly different since then.

Household Sector Capital Accounts Q1-Q3  2007-2016

In 2007, the household sector’s Gross Saving of €7.1 billion was significantly less than the €18.6 billion of gross capital formation undertaken by the household sector (mainly on new houses).  This meant that the household sector was a net borrower in the non-financial accounts to the tune of €11.6 billion.  [Of course, overall borrowing by the household sector was much larger but a lot of that was to buy existing houses of each other so appears in the financial accounts.]

The household sector has been a net lender since 2009 averaging just over €4 billion a year for a total of €29 billion.  Gross Capital Formation by the household sector has begun to increase and the growth rates are impressive.  The figures in the above table show a growth rate of 15 per cent in 2015 with this rising to 20 per cent in 2016.  But this is from an very low base.

It can be seen that for most recent years Gross Capital Formation was just ahead of depreciation (consumption of fixed capital) so there would have been little increase or improvement in the capital stock held by the household sector (mainly houses).

There has been a significant reduction in the gross indebtedness of the household sector.  Total loans outstanding were €203 billion at the end of 2008 and will likely have fallen to €140 billion at the end of 2016.  Some of the €29 billion of net lending identified above will have been used to repay debt while others will have sold assets to repay debt.

All in all, the ISAs show strong improvement in the current account for the household sector but the capital and financial accounts show that this is needed, and more, as we continue to work through the legacy effects of the boom/bust.

Printfriendly