Monday, July 25, 2016

The size of the provision for depreciation

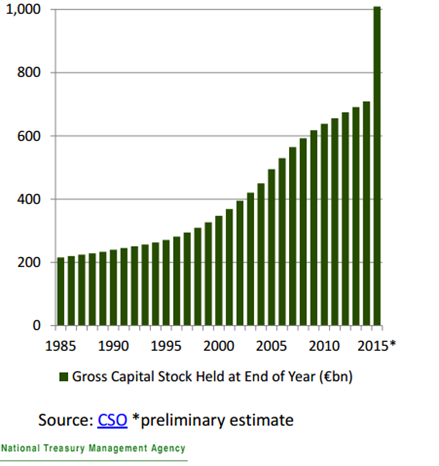
The key reason for the 26 per cent rise in Irish GDP was the large increase in the productive capacity of the economy as represented by the €300 billion increase in the gross capital stock.  The addition of these assets to Ireland’s capital stock hugely increased the amount of value added that the economy could produce.

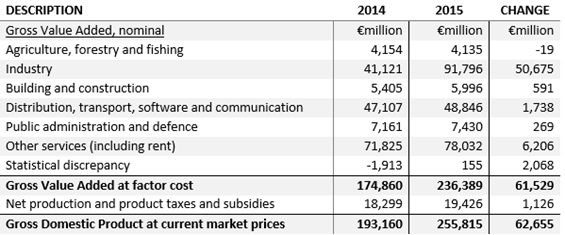
We know that most of the changes are due to the actions of MNCs so most of the increase in GVA accrued to them.  Infact 80 per cent of the increased GVA came from firms in the “Industry” sector (as shown here).

If GVA formed the tax base then the provision for depreciation wouldn’t really be an issue but firms can avail of “capital allowances” for the acquisition of certain assets, i.e. they can offset (part of) the cost of the asset against their taxable income for a given period (generally eight years).  This is somewhat similar to the “consumption of fixed capital” concept in national accounts where the value of capital assets is reduced as they are used and become obselete. 

Both are generally described as “depreciation” but there are important differences between them.  We only have the 2015 consumption of fixed capital figure from the national accounts for now but there is no reason to believe that capital allowances in 2015 will not have followed a similar pattern, i.e. a massive jump up.

So although there may have been a large increase in gross value added this may not correspond into an equally large increase in the tax base if capital allowances impact on the calculation of taxable income.  It is a pretty safe assumption that the capital allowances used by companies increased broadly in line with the consumption of fixed capital shown in the national accounts.

So is this an issue?  Possible.  GDP is commonly used for international comparisons.  If the amount of depreciation is the same across countries then it gives ratios that have a value in making comparisons.  Here is depreciation as a per cent of GDP for the countries of the EU (excluding Luxembourg for which data does not seem to be available).

Depreciation to GDP

The 2015 figure is for Ireland and this puts Ireland at top of the pile and the 2014 figure shows the huge impact the 2015 figures had on our position.  In relative terms Ireland now has the largest provision for depreciation though the gap to the next country, Latvia, is relatively small.  As depreciation is removed from the corporate tax base through capital allowances this means GDP may overstate Ireland’s tax base relative to other EU countries.

We already knew that GDP overstated the Irish tax base as it includes the profits of MNCs based here.  We can have great fun with hybrids etc. but lets just put the provision for depreciation in terms of Gross National Income (seeing as this aggregate is used in the  calculation of a country’s contribution to the EU).

Depreciation to GNI

And here we can see the outlier that Ireland i2 for 2015 compared to the mid-table ranking for 2014. Within Ireland’s GNI there now is a disproportionate provision for depreciation.  And as this is value added which is not included in Ireland’s tax base we get close to little of benefit from it.

We now have a situation where using GNP or GNI as a denominator excludes the profits of MNCs that we can get a 12.5 per cent chunk out of before they leave but includes a massive provision for depreciation for these companies that we get nothing from.  If these effects offset each other then maybe GNI is a useful denominator for EU contributions and the like but with the headline data we have at the moment it is impossible to tell.

How did the capital stock increase by €300 billion when investment was just over €50 billion?

There are many mysteries in the 2015 National Income and Expenditure Accounts published by the CSO two weeks ago.  The change that had the biggest impact on the accounts and was the source of the 26 per cent GDP growth was the €300 billion rise in the gross capital stock.  The bizarre nature of this is shown in this chart from a recent NTMA investor presentation.

NTMA Capital Stock

We know very little about this €300 billion increase.   The CSO will be publishing final figures for the capital stock later in the year but it is not clear that the sectoral and type figures usually provided will be made available for 2015.

Most commentary has linked the increase to inversions by US MNCs and redomiciling by PLCs from other countries.  It is not clear that this is the cause of the increase.  A company moving its headquarters does not automatically mean that it’s stock of fixed assets are included in Ireland’s capital stock. 

If a US pharmaceutical company does an inversion with an Irish company the manufacturing plants the company has in the US and other countries will remain part of the capital stocks of those countries.  The company may move intangible assets to Ireland but that would be a move separate to the inversion.  Also the only inversion in 2015 was the Medtronic-Covidien match-up which comes no where near the scale shown above.

A key problem is that we don’t know the type of assets that made up the €300 billion increase in the capital stock.  We can take it that much of it is intangible assets (leased aircraft are also said to have played a role but that may have been overstated).  The reason for this uncertainty is that gross fixed capital formation was just over €50 billion.

So how do we get a €300 billion increase in the gross capital stock with a little more than €50 billion of investment?  This seems hard to explain.  With the scrapping and obsolescence of some existing capital we should expect the increase in the gross capital stock to be less than the level of gross investment.  And, in theory, the movement of assets between countries should be de-investment in one country and investment in another country.  The ‘G’ in GFCF refers to depreciation.  Capital formation itself is made up of the net of acquisitions and disposals of fixed assets.

So why was the increase in the capital stock nearly six times greater than the level of investment?

One reason could be that different assets are included in each but that seems unlikely as they are supposed to be related measures.  It could be that US MNCs have transferred the economic rights to exploit their intellectual property to Irish-resident entities and that these economic rights are counted in Ireland’s capital stock but as the patent is retained by the US parent there is no investment expenditure in Ireland.  Not sure.

Another possibility are valuation differences between how the assets are counted for investment and for the capital stock.  It could be that these assets are counted in the investment data on some sort of “cost-plus” basis, i.e. the amount of R&D expenditure it took to actually produce them.  While in the capital stock the assets are counted on the basis of how much they are worth.

There was a large increase in R&D expenditure in 2015 in the €54 billion GFCF total and it went from €9.6 billion in 2014 to €21.3 billion in 2015.  But is €12 billion of additional R&D expenditure enough to explain an increase of a few hundred billion in Ireland’s capital stock.  I suppose it depends on what intellectual property rights were moved to Ireland the value of which does not necessarily depend on the R&D expenditure that went to generating them.

Whatever the reason it seems we need a more nuanced story than linking the increase in the capital stock to inversions and redomicilied PLCs.  In fact, given the massive increase in external debt linked to direct investment shown in previous posts such corporate restructurings don’t seem like a useful explanation at all.

Hundreds of billions more on the stock of FDI debt but where are the interest flows?

The last post looked at the revisions of Ireland’s international investment data.  Here we look for the impact the massive changes shown there have on the flows in the current account.  As was shown there have been huge changes in the stock of debt associated with direct investment (both inward and outward).

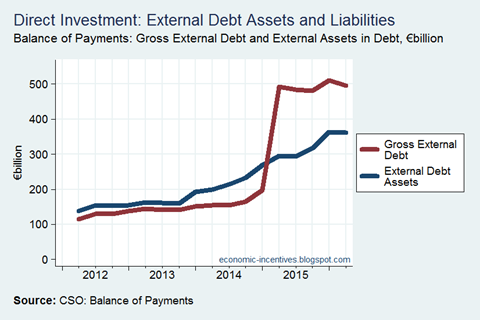
Direct Investment Debt

Gross external debt associated with inward direct investment shows an incredible €300 billion level shift in Q1 2015 which is associated with the transfer of intangible assets to Ireland by foreign-owned MNCs.  On the other hand external debt assets which is linked to outward direct investment, and likely driven by inversions and redomiciled PLCs, has been shown a strong increase since the middle of 2013 and is up around €200 billion over the period.

But we look at the flows on income on direct investment debt in the current account we see the following:

Direct Investment Income on Debt

The flows have barely moved over the period.  The stability on the outflows seems particularly odd given the massive once-off level-shift of €300 billion that the first chart shows in the stock of debt.  So FDI entities in Ireland have massive external debt liabilities but aren’t making  increased outbound interest payments. What gives?

Friday, July 22, 2016

Revisions to Ireland’s International Investment Data

Back in March we looked at the FY2015 International Investment Data with a post showing that Ireland’s net external debt was zero at the end of 2015.  Although most of the attention over the past ten days has been on the revisions to GDP and related measures there were also massive revisions to the international investment and external debt data which were published on the same day. 

Most of the changes are linked to the take-out chart from the CSO presentation on the national accounts revisions.

Gross Capital Stock

This shows that Ireland’s gross capital stock increased by an incredible €300 billion in 2015.  GFCF was a little more than €50 billion so there must be a lot of reclassifications going on.

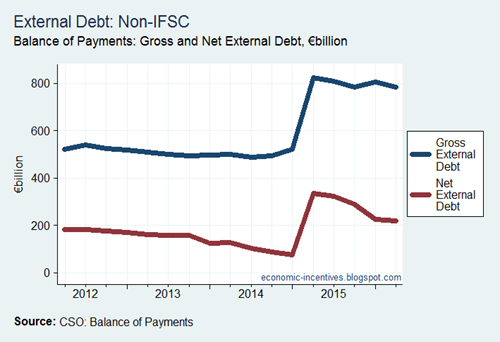
At the headline level it now appears that saying that Ireland’s net external debt was zero was out by the little matter of €200 billion or so.

External Debt

It’s pretty clear when all of the action happened – Q1 2015 when Ireland’s gross and external debt rose by around €300 billion.

The sector that this additional borrowing resulted from is fairly easy to identify.

Gross External Debt by Sector

All of the increase was associated with direct investment.  This is debt associated with the assets transferred to Ireland in 2015.  The Irish-resident entity which now holds the assets owes a debt liability to an external entity based on the value of those assets. 

This would suggest that most of the asset transfers are not linked to inversions because in that instance there would not be an external debt as the asset would be owned by the now Irish-resident parent of the company.  And the fact that the shift happened in Q1 raises issues about the number of firms involved.  If it was a large number of firms would they all have been in a position to make the transfer at roughly the same time?

Inversions and redomiciled PLCs are part of the overall story but do not seem to have been significant in the massive level-shift seen in Q1 2015.  If we look at external assets in debt instruments (i.e. money owed to Irish-residents) we see the following:

External Assets in Debt by Sector

There is a rise in external debt assets related to direct investment but that began in the middle of 2013 and has continued at a relatively steady pace since then.  The number of inversions of US companies to Ireland has been relatively small and there was just one in 2015 (Medtronic and Covidien).

What this means is that the scale of the figures for the NFC (non-financial corporate) sector is now approaching the realm of the IFSC as we will have to begin counting them in trillions.  However, one significant different to the IFSC is that the overall net position is not close to zero.  Here are the total foreign assets and liabilities of Irish-resident NFCs.

Foreign Assets and Liabilities of NFCs

We can see the massive gap that opened up in 2015.  The gap is largely explained by the huge amount of intangible assets that Irish-resident entities now hold domestically which obviously don’t appear in international investment figures.

So where does this leave us in trying to determine the underlying net international investment position of the Irish economy?  Well, here are the net external debt positions by individual sector.

Net External Debt by Sector

The stand-out figure is obviously for direct investment which shows a bizarre pattern.  The net position associated with direct investment became more negative (debt assets exceeding debt liabilities) from the middle of 2013 through to the end of 2014.  There was than a massive level-shift of €200 billion in Q1 2015 after which the previous downward trend resumed.

The two effects can be better seen here which gives the external debt liabilities and assets associated with direct investment.  The net position is as shown in the previous graph.

Liabilities and Assets of Direct Investment

We can see that gross external debt for direct investment is relatively stable save for the massive level-shift in Q1 2015.   This is linked to the transfer of intangible assets to Ireland.

External debt assets associated with direct investment begin rising in mid-2013 and has continued at a relatively steady pace since.  This is related to inversions and redomiciled PLCs.

It is pretty clear that these don’t really reflect the underlying position of the economy so it would be better exclude direct investment from the total economy figures (while excluding the IFSC at all times!).

External Debt ie

These outcomes can be compared to those shown in the second chart above and better reflect the improvement in Ireland’s underlying external debt position.

And we include all financial assets and not just debt instruments we get this final picture for our overall net international investment position.

Net International Investment Position

The total economy figures are polluted by the direct investment effects outlined above.  The underlying position is better identified if we exclude NFCs and we see that Ireland has a small positive NIIP (excluding NFCs).  The government sector’s external debt of €150 billion is roughly offset by financial intermediaries (mainly Irish pension funds) external assets of a similar amount.

So what do all the revisions tell us?  It is hard to  know but it does seem that asset transfers played a greater role to what happened in 2015 than corporate inversions.

Why did the assets transfers happen?  A key factor seems to have been the BEPS project which has the underlying objective of linking profit to substance and increased transparency through country-by-country reporting.  We know that lots of US MNCs already have substance here but that doesn’t really explain why the assets were transferred here rather than through outright purchases (which would appear in GFCF).  Another factor is that it is possible that the assets were held by Irish-registered but non-resident entities.  Making these entities Irish-resident would bring the assets with them. 

So companies may be continuing to avail of the ‘double-irish’ but now actually have the two companies in Ireland (as opposed to having both registered here but one managed and controlled in the Caribbean). How will Uncle Sam feel now that we are taking a 12.5% chunk out of these profits?

Wednesday, July 13, 2016

26% GDP Growth: Where did it come from and who got it?

The reaction yesterday to the publication of the National Income and Expenditure Accounts showing 26 per cent real GDP growth was as one would expect given that such a growth rate was completely unexpected.  There was lots of talk of the numbers not reflecting the reality of the Irish economy but I didn’t come across anybody who said they did while talk of “leprechaun economics” was just derogatory.  The underlying growth rate of the Irish economy is probably somewhere around six per cent which is just fine, thank you.

Yesterday’s figures show that real GDP expanded by 26 per cent in 2015. We have known for a long time that GDP is a problematic measure for Ireland and recent developments just accentuated this. 

What change resulted in the transfer of €300 billion of assets to Ireland?  We can safely assume that much of this is related to tax but the Irish corporate tax regime has hardly changed over the past few years.  The Knowledge Development Box only applies to intellectual property that is developed here and, if it was in any way effective at all, would show up through increases R&D activity in Ireland rather than the transfer of assets to Ireland.

What has changed is the international tax environment.  The OECD’s BEPS project has an underlying goal to align profit with substance and the aim of providing more information for tax authorities through country-by-country reporting.  It is clear that one consequence of this has been for companies to move more risks, functions and assets to Ireland.  There may have been the view that Ireland was a target of the BEPS project but, for now at least, it is clear that we are a beneficiary of it.

And the benefits are massive.  Increased profits in Ireland means increased taxable income subject to our Corporation Tax.  We know the Corporation Tax receipts rose from €4.6 billion in 2014 to €6.9 billion in 2015 with a good likelihood of a further increase in 2016.  €2.3 billion is a massive amount of money.  If the cost of collecting an extra €2.3 billion in tax is a few days of headlines about bizarre growth rates sign me up.

So where did the growth come from?  Well the standard Y = C + I + G + (X – M) isn’t very helpful as the level of noise between the components makes identifying underlying trends almost impossible.  To be fair consumption is unaffected by much of this and grew by 4.5 per cent in 2015 which is a good clip.

To get a better picture we should look at the output method and the gross value added generated by the different sectors of the economy.  Here are the gross value added in nominal terms for the six sectors used by the CSO.

Gross Value Added

As can be seen gross value added increased by €61.5 billion in 2015 and when we add in the €1.1 billion increase in net product taxes we get the €62.7 billion increase in nominal GDP.

The sectoral data show that over 80 per cent of this came from the Industry sector.  We are usually provided with a further breakdown of this into sub-sectors such as chemical and pharmaceutical, computers and instruments, and medical and dental devices but this was not published by the CSO on this occasion.

There has been a lot of attention on the impact of aircraft leasing on the figures but the impact of this sector on the growth outcome seems to be overstated.  Aircraft leasing is included in the broad category of “Other services”.  This sector accounts for only ten per cent of the increase in gross value added and aircraft leasing will only be a portion of that.

Next we turn to the beneficiaries of this growth surge and look at the wage and profit gains from net value added and also the important changes to the provision for depreciation.

Net Value Added

We can see that of the €62.6 billion increase in GDP only €30.9 billion went to households and firms in the form of wages, profits or mixed income.  Another €1.1 billion went to the government in the form of product taxes but the most notable change in the €30.7 billion rise in the provision for depreciation.

It is pretty clear that most of this applies to companies in the industry sector.  In this sector alone gross value added rose by €50.7 billion while the profits of all companies rose by €23.1 billion.  There are two ways to cut the reconcile this difference of €27.6 billion. 

The first is employee remuneration which is up but only by €4 billion or so.  The second is depreciation which is subtracted from gross value added to get net value added.  The provision for depreciation in the Industry sector must make up a large part of the overall €30 billion provision for depreciation.  And foreign companies will dominate this.  In a bit of a simplification companies are making gross profits (sales minus cost of goods sold) and a large portion of this is going to cover the reducing value of assets that they hold.

The €23 billion rise in company profits before tax is roughly in line with the €2.3 billion rise in Corporation Tax (suggests an effective rate of around 10 per cent which is before financing costs above FISIM are accounted for).  It can also be seen that the net factor income outflow roughly corresponds to the increase in company profits which is what we would expect.

Gross National Product strips out most MNC profits but it does not account for depreciation and it is now clear that most of the provision for depreciation in our national accounts accrues to foreign firms.  We should be counting this as an outflow as well which may be angle the CSO might take if looking to provide some auxiliary economic indicators.

So if we look at the €62.7 billion increase in nominal GDP we can break it down as:

  • Households
    • €4.2 billion of employee remuneration
    • €1.5 billion of self-employed/mixed income
  • Companies
    • €23.1 billion of company profits (mainly foreign companies)
  • Government
    • €1.1 billion of product taxes
  • Non-Sectorised
    • €30.7 billion for depreciation (mainly foreign companies)
    • €1.9 billion for stock adjustment/statistical discrepancy

Tuesday, July 12, 2016

The IRS are investigating the crucial component of Facebook’s tax structure

The ongoing investigation by the US Internal Revenue Service into Facebook’s 2010 tax return attracted some renewed attention last week when the IRS filed a court petition in California looking for further documentation from Facebook.

The investigation relates to the most crucial aspect of the international tax structures used by US MNCs – getting the global rights to their intellectual property outside the jurisdiction of the US.  In 2010, Facebook Ltd transferred the global rights to its IP to Facebook Ireland Holdings.  The IRS are investigating the nature of this transfer and whether the correct price was paid for the assets transferred.

We know that Facebook has a trading company here, Facebook Ireland Limited, and that this company collects substantial revenue from selling advertising and other services on the Facebook platform.  However Facebook Ireland Limited doesn’t own the rights to the IP and must pay royalties for the right to use the Facebook platform.  These royalties are paid to Facebook Ireland Holdings who obtained the rights from Facebook Ltd.

We know that other US companies (Google, Apple etc.) have somewhat similar structures and that these companies have R&D cost-sharing agreements whereby their offshore subsidiaries are granted the non-US rights to their IP in return for making contributions to the cost of their development.

It is likely that Facebook has a similar arrangement in place but this can really only apply to new or ongoing IP development.  When the transfer was made in 2010 the Facebook platform was already in existence and Facebook Ireland Holdings would have to pay based on the value of this existing technology at the time rather than the historical cost of its development.  Although few details are available it seems that it is this price paid in 2010 that the IRS is investigating.  It is also possible that the outcome will affect subsequent tax years if the R&D cost-sharing agreement is found to be inappropriate.

From an Irish perspective almost all reports on the court petition state that the rights to the IP were transferred to Ireland.  However, this is not correct.  Facebook has its international operating company in Ireland but the holding company is not based in Ireland – even though it is called Facebook Ireland Holdings.

Facebook Ireland Holdings is registered in Ireland but it is not managed and controlled in Ireland nor has it any risks, functions or assets in Ireland so it is not liable for Irish Corporation Tax.  They have been some reports linking Facebook Ireland Holdings to the Cayman Islands but with no corporation tax or filing requirements there it is hard to tell.  And, of course, as we have seen in the case of Apple this holding company could be managed and controlled in the US and still generate the same tax outcome.

Anyway the central element is to get the global economic rights to Facebook’s IP outside of the US.  If the holding company has to pay a high price to the parent then the profit becomes subject to the US corporate income tax.  However, even if the price is low it shouldn’t really matter as the US has a worldwide corporate income tax regime with all profits of US companies being subject to US tax regardless of where they are earned so a bit more than just getting the IP outside the US is required.

For this we look to the the deferral provisions in the US tax code where the payment of the corporate income tax due on foreign profits does not become due until the profits are formally repatriated to a US-registered entity in the company’s structure.  There is a general deferral for trading profits.  This means the profits earned by Facebook Ireland Limited are not subject to US tax until they are repatriated.

However, Facebook Ireland Limited is not a massive profit generator.  It collects large revenues (€4.8 billion in 2014) but most of this is paid out in royalties as it is granted to rights to sell on the Facebook platform through a cost-plus agreement with Facebook Ireland Holdings.

Facebook Ireland Holdings receives significant royalty payments from Facebook Ireland.  There is no general deferral provision from the US tax due for passive income so, in theory at least, Facebook would have to pay the 35 per cent US corporate income tax on the royalties received by Facebook Ireland Holdings.

There are, however, a number of exemptions that grant a deferral of the US tax due on passive income.  One of the most crucial of these is the “same-country exemption”.  Under this provision passive income transfers between companies in the same country do not trigger the payment of the US tax due on the profits from such transfers.

The US tax system judges this on the basis of country of incorporation.  Thus if two companies are registered in the same country a passive income transfer between them does not trigger a US tax payment until the profits are repatriated.  Both Facebook Ireland Limited and Facebook Ireland Holdings are Irish incorporated so the transfer between them is eligible for this exemption. 

The IRS are not investigating this transfer and the cost-plus arrangement between the Facebook subsidiaries would be a matter for our Revenue Commissioners (while the European Commission have taken up investigating some of the cost-plus arrangements entered by Apple).  The IRS are investigating how much money gets from Facebook Ireland Holdings (possible in the Cayman Islands) back to the parent in the US.

This is the crucial component of the tax structure.  If Facebook Ireland Holdings pays most of the profit back to Facebook Ltd in the US then the rest of the structure is largely moot as the US tax becomes due anyway.  But if Facebook Ireland Holdings pays a substantially lower price relative to the royalties it receives then the structure can successfully defer the payment of significant corporate income tax payments to the US.  And it does!

It is the IRS that matters in all of this and they are clearly not satisfied with the size of the transfer between Facebook Ireland Holdings and Facebook Ltd.  There isn’t really a lot that other countries can do about it.  Countries can look at the activities US companies carry out in their jurisdictions and determine whether they are taxed appropriately.  In the UK, HMRC completed a six-year audit of Google earlier this year and accepted the basic principles of Google’s structure.  And no matter how many times it is erroneously linked the location of customers is not a taxable activity of a company!

Printfriendly