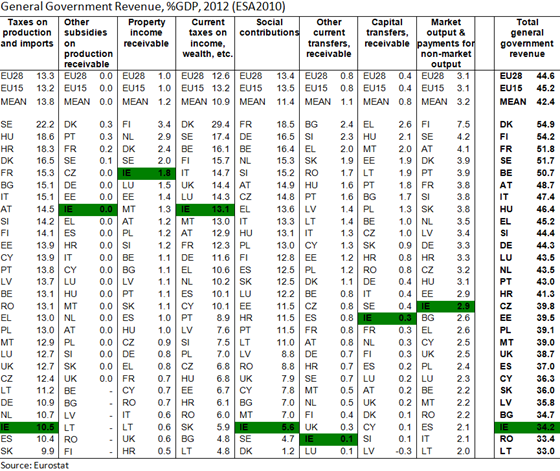
Government revenue as a proportion of GDP is lower in Ireland than in most other EU countries. The most complete figures are for 2012 and these show a level equivalent to 34.2 per cent of GDP (using ESA2010). For 2013 the level was 34.8 per cent of GDP but a detailed breakdown of this is not yet available for all EU countries.
Here is the breakdown of general government revenue in all 28 EU countries. For the most part we will stick to comparisons in terms of GDP but will explore some implications of the GDP/GNP gap towards the end. Click to enlarge.

In the total column Ireland is third from the bottom with only Romania and Latvia recording lower levels. Ireland is around ten percentage points of GDP below the weighted average of the EU28 and 8 percentage points below the simple arithmetic mean of the 28 member states.
Ireland is at the EU average for receipts from taxes on income and wealth. The lower overall revenue is largely driven by lower than average receipts in two categories:
- Taxes on production and imports: 3 pp below EU28
- Social contributions: 8 pp below EU28
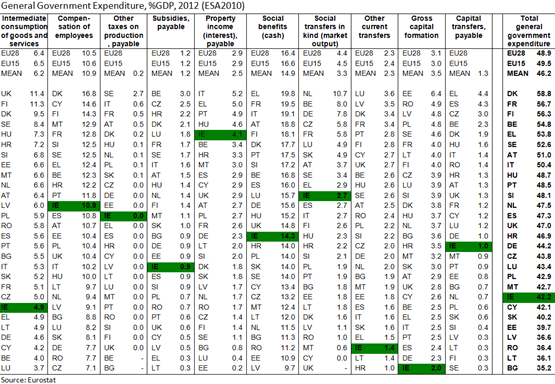
Unsurprisingly, Ireland is also below the EU averages when it comes to general government expenditure. Again click to enlarge.

For expenditure Ireland rises to eighth from the bottom (though the 42.2 per cent of GDP figure for 2012 had fallen to 40.5 per cent of GDP in 2013).
The sources of the lower-than-average expenditure in Ireland are broader than the reasons for the below-average revenue. The eight percentage point of GDP gap to the EU weighted-average (it is a four point difference to the un-weighted arithmetic mean) can be explained by:
- Intermediate consumption: 1.5pp below EU average
- Social benefits: 2pp below EU average
- Social transfers-in-kind: 2pp below EU average
- Other current transfers: 1pp below EU average
- Gross capital formation: 1pp below EU average
Current transfers of one form or another account for 5 percentage points of GDP of the gap to the EU average. Ireland is lowest in the EU when it comes to public gross capital formation as a proportion of GDP (though capital expenditure by the ESB, Bord Gais as it was and other semi-states is not included).
If we examine public expenditure by function the following picture emerges. Note the figures in the following table were compiled using ESA95 meaning there are some methodological differences to those in the previous table. Click to enlarge.

Unsurprisingly, the bulk of the gap to the EU average is explained by social protection expenditure.
- Social protection: 4pp below EU28 level
- Defence: 1pp below EU28 level
- General public services: 1pp below EU28 level
Our final step is to look at social protection expenditure and see it is exactly we are spending less on (and paying less for through lower social contributions). Unfortunately the detailed breakdown by function is not available for four countries (Belgium, Spain, Romania and Slovakia) but the details for the other 24 countries are presented below. This is the first table where most of the green cells are in the top half of the rankings. Click to enlarge.

Ireland’s public expenditure on social protection is in top 12 for six of the eight sub-categories (and 13th in another). Ireland is in the top four for ‘family and children’, ‘unemployment’ and ‘housing’.
The only category where there is a gap of note to the un-weighted arithmetic mean (of the 24 countries for which data is available) is ‘old-age’. Ireland is almost five percentage points of GDP below the mean level of public social protection expenditure on ‘old age’. This is mainly expenditure on social welfare pensions
The finals columns of the above table show that excluding the ‘old age’ sub-category, in 2012, Ireland had the third-highest level of social protection expenditure among the 24 countries for which the measure can be constructed. This ranking is likely to be unchanged even if the data were available for the other four countries.
If Ireland collected and spent the equivalent of an additional five per cent of GDP on public pensions to mimic the “average” EU system then government revenue and expenditure figures would be closer to the EU average:
- 40% of GDP versus EU average of 45% for revenue, and
- 47% of GDP versus EU average of 50% for expenditure
It is social welfare pensions more than anything that account for the “low-tax” “low-spend” monikers that are sometimes applied to Ireland.
Of course there are factors that explain the relatively low level of public social protection expenditure on old age (if not the level of revenue). A big factor is the proportion of the population aged over 65. In 2012, Ireland had the lowest ‘over 65’ dependency ratio in the EU.

The proportion of the population aged over 65 was 12 per cent in Ireland compared to an EU level of 18 per cent. Obviously though this can only explain around half of the gap between Ireland’s public social protection expenditure on ‘old age’ and the EU mean.
Across the EU every one per cent of the over 65 dependency ratio adds the equivalent of around 0.52 percentage points of GDP to social protection expenditure on ‘old age’. This is shown in the final column of the above table which is social protection expenditure on ‘old age’ as a proportion of GDP divided by the dependency ratio.
In Ireland every one percentage point of the dependency ratio equates to 0.39 percentage points of GDP on ‘old age’ social protection expenditure. This explains the other half of the gap between Ireland’s expenditure in this category and the EU mean. Only Croatia (0.20) and Lithuania (0.33) spend less under this measure (noting it can’t be calculated for Belgium, Spain, Romania and Slovakia using present data).
We have fewer pensioners and have a system of social welfare pensions that involves less revenue and expenditure than in other EU countries. As a proportion we spend about one-third less than the EU mean on public social protection pensions. This is likely because we have social welfare pension benefits that are not pay related rather than having a flat rate payment that is too low.
What changes, if any, should be introduced to our public pension system are not at issue here. All that is being highlighted is the impact expenditure on ‘old age’ has on our government finance aggregates.
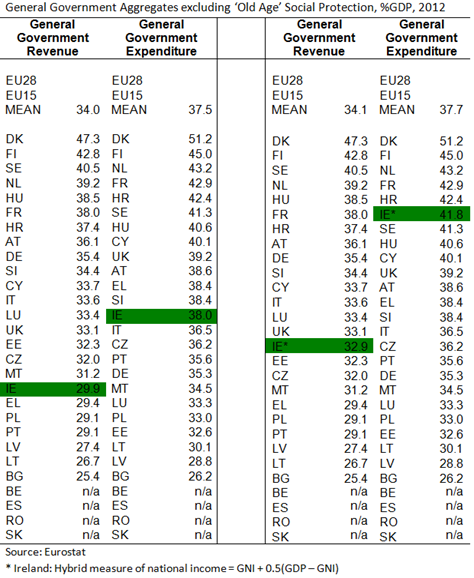
If we make the heroic assumption that social protection pensions are provided on a cost-neutral basis (i.e. contributions received match benefits distributed) and strip these figures out of government revenue and expenditure we get the following picture. Again click to enlarge.

After doing this we can see that revenue remains below the EU mean (by about 4 percentage points of GDP) and expenditure is pretty much the same as the EU mean.
The panel on the right tries to take account of the GDP/GNP gap that exists in Ireland using a rough hybrid measure. Thus the two adjustments made to the panel on the right are:
- removal of ‘old age’ social protection expenditure and implied revenues, and
- adjustment of national income figure for Ireland
After this it can be seen that government revenue in Ireland is close to the arithmetic mean (again noting that four countries are excluded because of data availability). For expenditure as a proportion of adjusted national income Ireland is above the EU mean and ranks sixth highest of the 24.
Outside of ‘old age’ social protection Ireland does not spend a relatively low amount on public services and supports. If there are problems with the public sector it does not appear to be because we don’t spend enough money.
Of course the interesting thing will be where these measures move to. The year 2012 cannot be take as a steady-state position given the size of the deficit that existed. We already know that, as a proportion of national income, revenue grew slightly in 2013 with a larger fall in expenditure.
The simple conclusion is that given demographics (fewer people aged over 65) and public pension system (flat rate payments) it is not surprising that Ireland is below EU averages for government expenditure.
Expenditure will rise as demographics dictate – the key is having the resources to meet it. We are not lacking spending to pay for the services we want now - though obviously the composition of that expenditure can be changed. We could raise additional revenue to spend now but perhaps it would also be advised to begin raising it to cover the inevitable pensions expenditure that we will need in the future.


