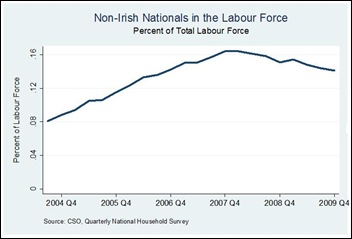
First we see that the number of non-Irish nationals in the labour force continues to decline, with 14,400 fewer in the labour force compared to Q3 2009. There were declines in both the employed (-7,600 to 255,200) and the unemployed (-6,800 to 47,900).
As a percent of the workforce, the number of non-nationals continues to decline and from a peak of 16.4 in early 2008 is now down to 14.1%, a level last seen in late 2006.

The origin of these workers continue to show that the main driven of change in this category is workers from the EU Accession states. There was a drop of 11,700 in the number of workers from these countries in the Irish labour force.

The non-seasonally adjusted unemployment rates for Irish and non-Irish workers show that there was a sharp drop in the unemployment rate of non-Irish nationals. This dropped from 17.2% to 15.8%. This drop occurred because a large number of this group who were unemployed left the labour force (and by assumption the country).

Breaking down the unemployment rate further we see that the best performing group are those from the EU15 (excluding Ireland and the UK) with an unemployment rate of 8.4% (up from 7.8%). The group worst affected by unemployment are workers from the EU Accession states with an unemployment rate of 18.6% (down from 19.5%).
 Tweet
Tweet


No comments:
Post a Comment